Which market aspects are bullish?
Retail sentiment analysis is pivotal for understanding market dynamics in forex trading. Retail sentiment, often a contrarian indicator, helps traders gaugethe crowd’s mood, enabling them to make informed decisions and avoid common pitfalls.
It's crucial for traders to incorporate this data into their strategies, allowing for a more comprehensive view of market conditions.
The value of retail sentiment lies in its ability to provide insights that are not immediately visible through technical analysis alone.
This layer of understanding can be the different between a profitable trade and a missed opportunity. Therefore, staying informed and regularly checking retail sentiment data can enhance one's trading strategy and overall success.
You can also learn from what other traders are doing. Observing market sentiment through clear signs gives you valuable insight into the common attitudes that drive trading in any market.
Retail sentiment refers to the overall mood or attitude of retail traders in the forex market. It often acts as a contrarian indicator, meaning when most retail traders are bullish, the market may soon turn bearish, and vice versa.
Using Retail Sentiment data, you can see the sentiment of traders for the most traded instruments, showing whether they are more positive (bullish) or negative (bearish) based in their trading positions.
As mentioned earlier, data on retail positions carry a counter-positioning logic. In other words, if a high percentage of traders are holding long positions, we should look for entry points to go short. Let's take a look at the collected data from the recent period and find confirmation or refutation of this statement
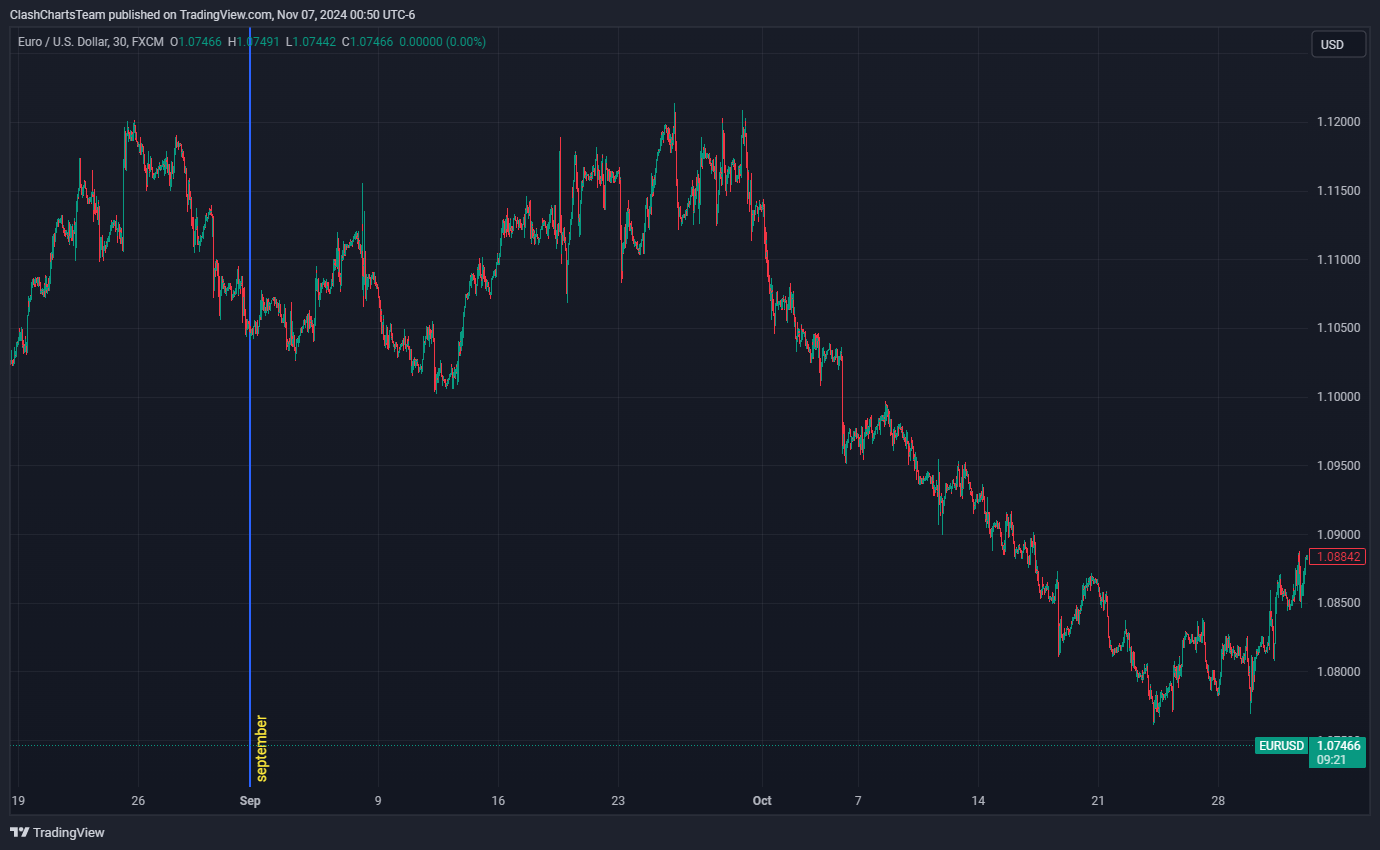
Below is an example for the EUR/USD pair from September 2024 to the present.

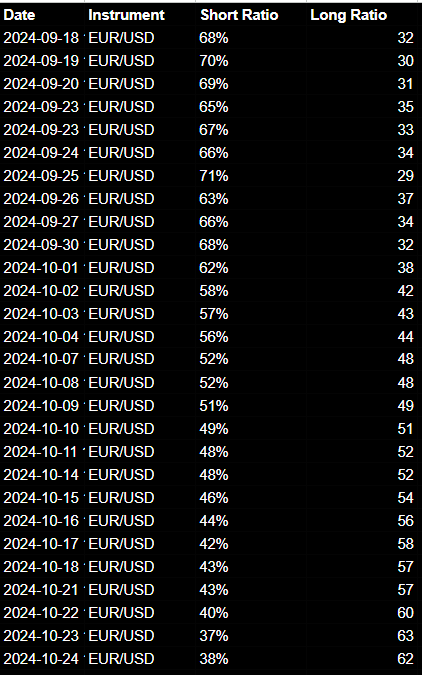
Now, here are the data reflecting retail positions on the euro for this period and how they changed as the price fluctuated

Just a heads up: up until September 30, 2024, traders were mostly holding short positions, with about 70% of all positions being short. But after that date, they started shifting towards long positions, and you could see the percentage of shorts dropping off.

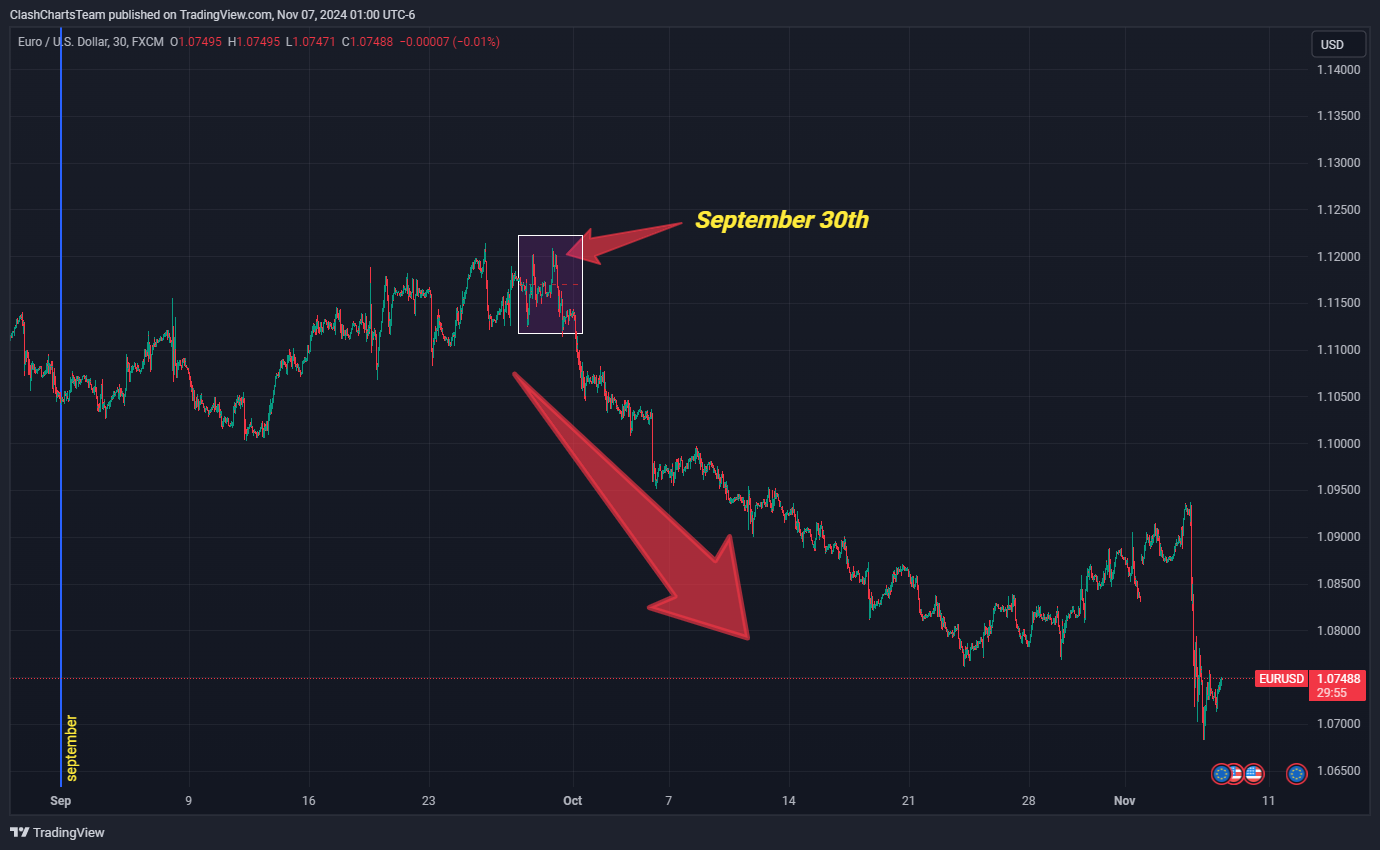
On the chart, you can see that a peak formed on September 30, and after that, prices turned around and started heading south, breaking through local support levels one after another. So, how did traders react? That’s right—they jumped in and started buying the dip. Not shorting, but buying! This behavior isn’t random: it actually follows a pretty clear pattern: retail tends to sell when prices are rising and buy when they’re falling. Irrational? For sure. You can definitely take that into account and do the opposite. Yes, you can and should, but do it smartly. Don’t just dive into a short position out of nowhere- wait for the right conditions and signals from your trading system.
We collect and aggregate data on retail positions daily, several times a day, and then we analyze it to assign a value to the current sentiment.
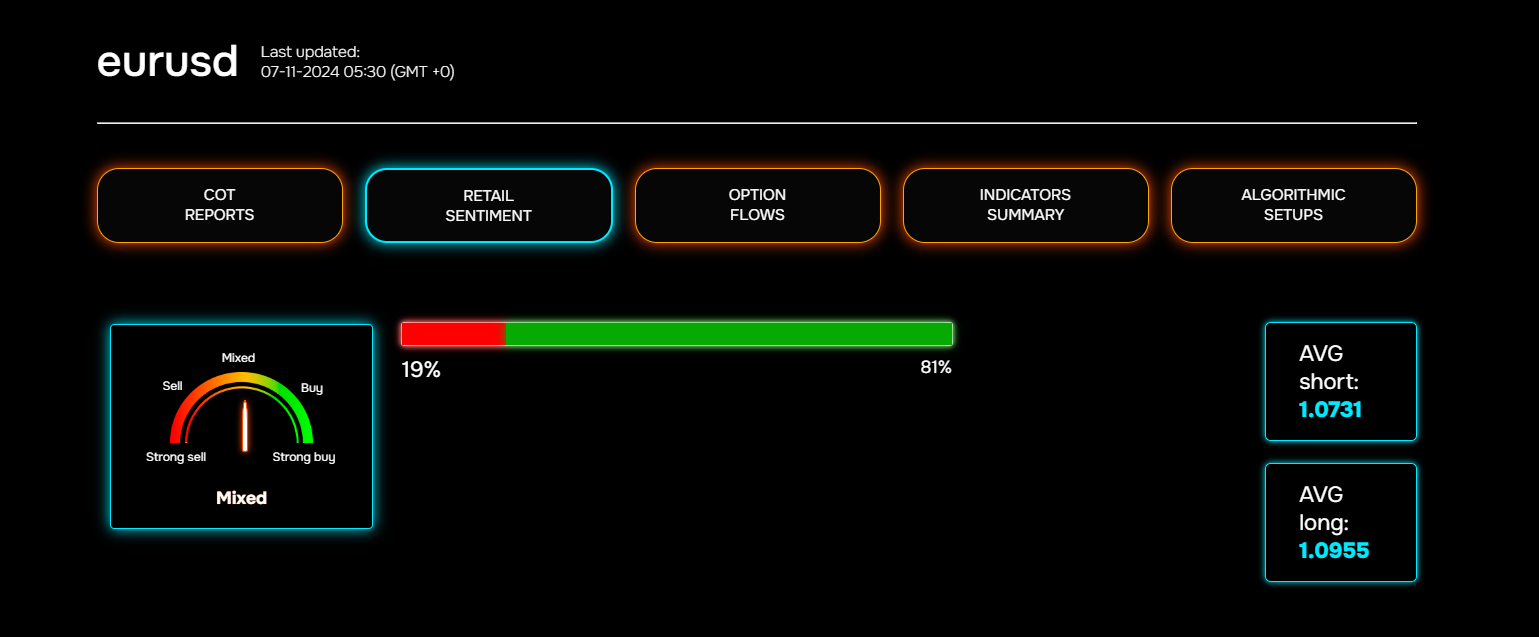
Below is a specific example from our platform as of November 7, 2024

The position ratio clearly favors the Bears, but the current retail positions shifts indicate a "Mixed" sentiment at the moment. So, it makes sense to wait for the indicator to move into the 'Sell' or 'Strong Sell' zone before making any moves.
Conclusions
Identify Trends: Use sentiment data to gauge the direction the majority of retail traders are leaning towards.
Contrarian Trading: Look for opportunities to trade against the crowd. If retail sentiment is overwhelmingly bullish, consider a bearish position, and vice versa.
Combine with Other Analyses: Integrate sentiment analysis with technical and fundamental analyses for a more comprehensive trading strategy.
